If you’ve tried this and still can’t sign in, contact your local office or email info@richardsonmediagroup.net.

The best and worst cities for women in tech

Women remain underrepresented in the tech sector. According to the Equal Employment Opportunity Commission, women make up “nearly half of the total U.S. workforce … [but] just 22.6% of the high tech workforce.” Opportunities for women in tech can vary considerably by location, and these differences shape access to jobs, career advancement and earning potential. In some places, women account for a larger share of tech workers, face narrower pay gaps and enjoy a stronger local labor market. In others, they may encounter a more challenging career environment.
SmartAsset evaluated data for 50 of the largest U.S. cities, assigning each a composite score based on four metrics: the pay gap between women and men in tech; women’s share of all tech workers; tech employment concentration, or tech workers as a share of the local workforce; and median earnings for women tech workers, adjusted for regional price differences. (The earnings adjustment accounts for local purchasing power, making salaries in higher- and lower-cost cities more comparable.)
Key Findings
- San Jose is the No. 1 city for women in tech. More than 1 in 10 workers in San Jose are employed in the tech sector. Of these workers, 27.2% are women, earning an estimated median income of $167,223, or $143,918 after adjusting for regional price differences. However, despite ranking No. 1 overall, women tech workers in San Jose earn 80.5% of what men earn.
- Detroit has the largest share of women in tech. Nearly 4 in 10 tech workers in Detroit, or 39.7%, are women, the greatest share in the study.
- This southern city is the top-ranking location outside the West Coast. Atlanta, home to Calendly, Cox Enterprises and Equifax, ranks No. 4 overall. Approximately 6.5% of Atlanta’s labor force works in tech. Women make up 28.8% of those workers, and women’s median earnings equal 87.5% of men’s earnings.
Bakersfield has the largest pay disparity. Bakersfield, California, is not widely known as a tech hub, and just 1.9% of its workforce is employed in tech. Those jobs are concentrated in local IT firms and in technology roles at non-tech companies. Women tech workers there earn 65.5% as much as men, the largest pay disparity in the study. In Bakersfield, the sample of women in tech is relatively small, so pay comparisons may be less precise than in other markets.
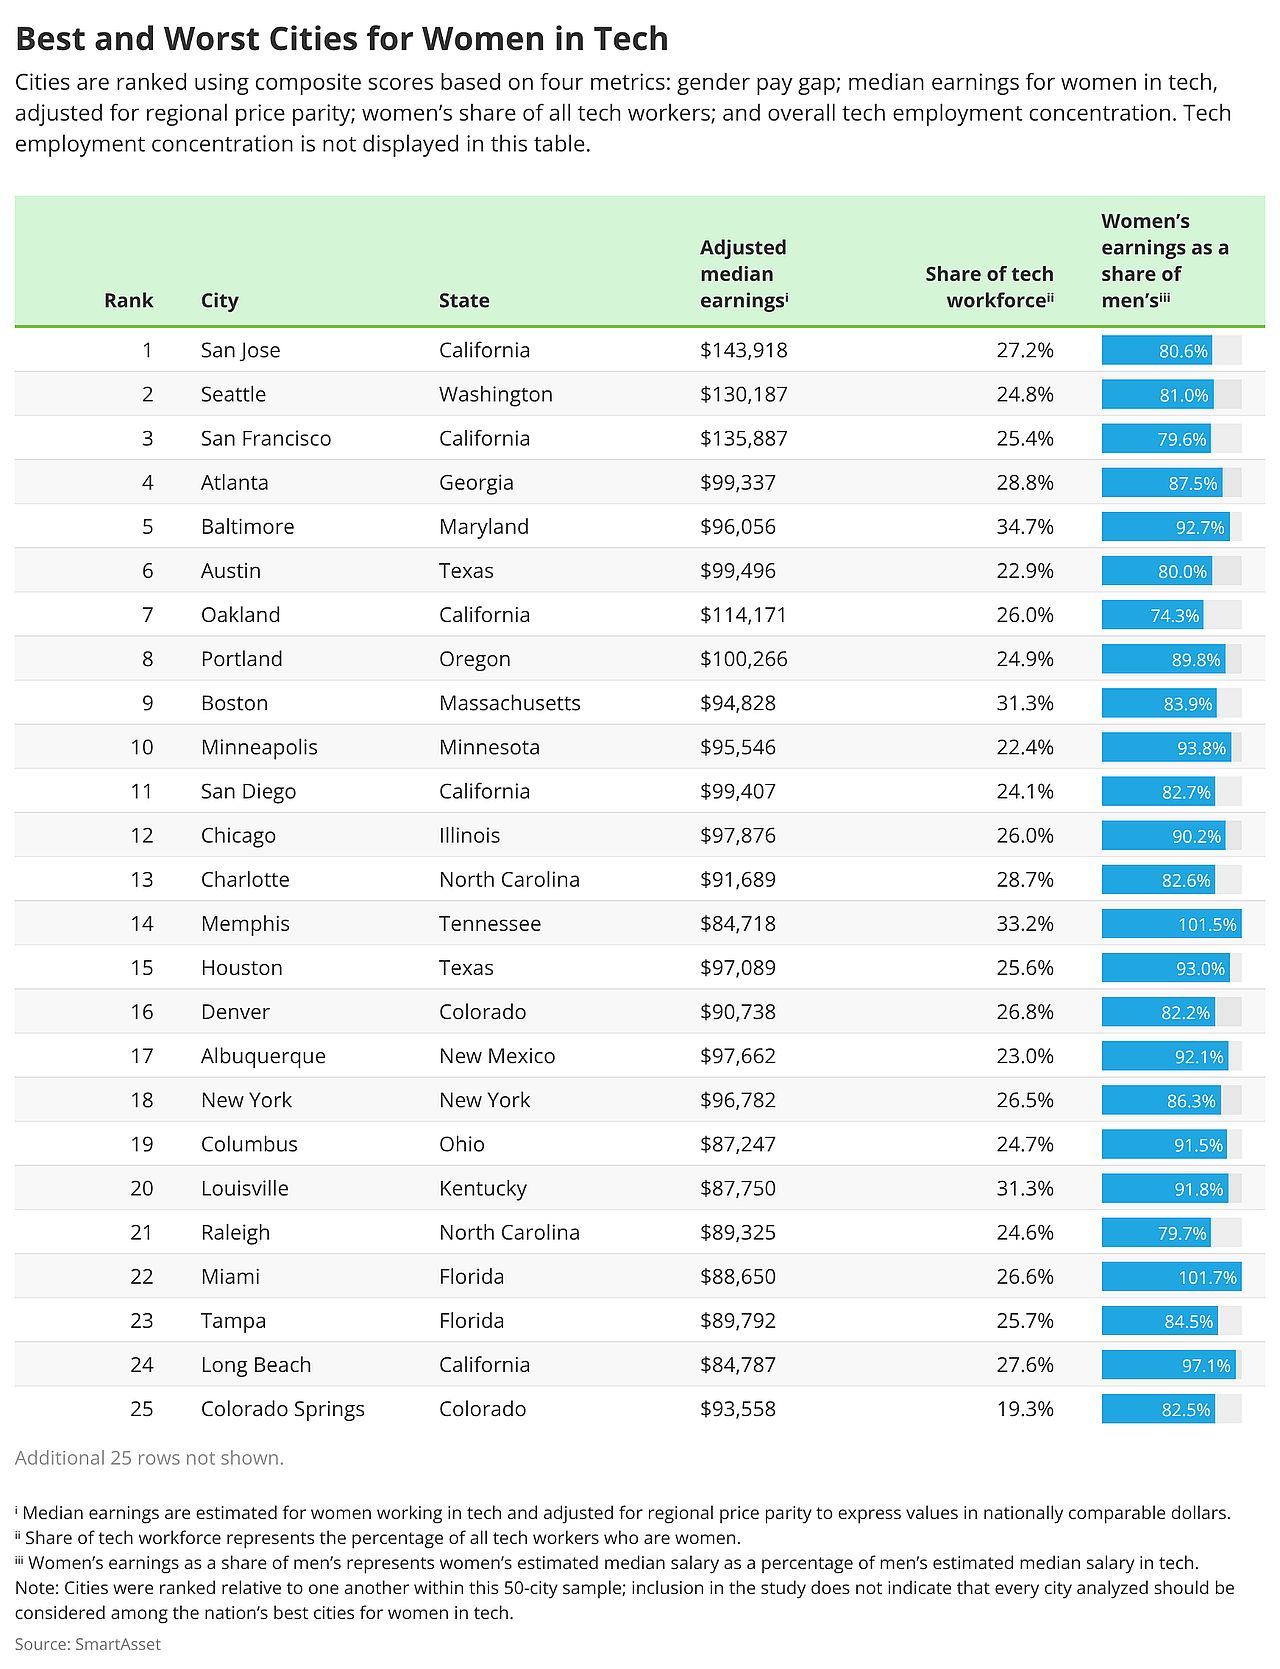
Cities Ranked
1. San Jose, California
- Women tech workers: 15,642
- Women tech workers, share of tech workforce: 27.2%
- Women tech workers’ estimated median earnings (adjusted): $143,918
- Women tech workers’ estimated median earnings (unadjusted): $167,223
- Women tech workers’ earnings as a share of men’s: 80.6%
- Tech workforce concentration: 10.5%
2. Seattle, Washington
- Women tech workers: 16,269
- Women tech workers, share of tech workforce: 24.8%
- Women tech workers’ estimated median earnings (adjusted): $130,187
- Women tech workers’ estimated median earnings (unadjusted): $152,241
- Women tech workers’ earnings as a share of men’s: 81%
- Tech workforce concentration: 13.4%
3. San Francisco, California
- Women tech workers: 12,743
- Women tech workers, share of tech workforce: 25.4%
- Women tech workers’ estimated median earnings (adjusted): $135,887
- Women tech workers’ estimated median earnings (unadjusted): $165,312
- Women tech workers’ earnings as a share of men’s: 79.6%
- Tech workforce concentration: 9.9%
4. Atlanta, Georgia
- Women tech workers: 5,532
- Women tech workers, share of tech workforce: 28.8%
- Women tech workers’ estimated median earnings (adjusted): $99,337
- Women tech workers’ estimated median earnings (unadjusted): $104,589
- Women tech workers’ earnings as a share of men’s: 87.5%
- Tech workforce concentration: 6.5%
5. Baltimore, Maryland
- Women tech workers: 4,444
- Women tech workers, share of tech workforce: 34.7%
- Women tech workers’ estimated median earnings (adjusted): $96,056
- Women tech workers’ estimated median earnings (unadjusted): $105,610
- Women tech workers’ earnings as a share of men’s: 92.7%
- Tech workforce concentration: 4.3%
6. Austin, Texas
- Women tech workers: 12,379
- Women tech workers, share of tech workforce: 22.9%
- Women tech workers’ estimated median earnings (adjusted): $99,496
- Women tech workers’ estimated median earnings (unadjusted): $102,670
- Women tech workers’ earnings as a share of men’s: 80%
- Tech workforce concentration: 8.7%
7. Oakland, California
- Women tech workers: 3,201
- Women tech workers, share of tech workforce: 26%
- Women tech workers’ estimated median earnings (adjusted): $114,171
- Women tech workers’ estimated median earnings (unadjusted): $138,893
- Women tech workers’ earnings as a share of men’s: 74.3%
- Tech workforce concentration: 4.9%
8. Portland, Oregon
- Women tech workers: 4,729
- Women tech workers, share of tech workforce: 24.9%
- Women tech workers’ estimated median earnings (adjusted): $100,266
- Women tech workers’ estimated median earnings (unadjusted): $111,224
- Women tech workers’ earnings as a share of men’s: 89.8%
- Tech workforce concentration: 4.9%
9. Boston, Massachusetts
- Women tech workers: 6,333
- Women tech workers, share of tech workforce: 31.3%
- Women tech workers’ estimated median earnings (adjusted): $94,828
- Women tech workers’ estimated median earnings (unadjusted): $108,032
- Women tech workers’ earnings as a share of men’s: 83.9%
- Tech workforce concentration: 5%
10. Minneapolis, Minnesota
- Women tech workers: 3,284
- Women tech workers, share of tech workforce: 22.4%
- Women tech workers’ estimated median earnings (adjusted): $95,546
- Women tech workers’ estimated median earnings (unadjusted): $105,386
- Women tech workers’ earnings as a share of men’s: 93.8%
- Tech workforce concentration: 5.6%
11. San Diego, California
- Women tech workers: 11,483
- Women tech workers, share of tech workforce: 24.1%
- Women tech workers’ estimated median earnings (adjusted): $99,407
- Women tech workers’ estimated median earnings (unadjusted): $117,036
- Women tech workers’ earnings as a share of men’s: 82.7%
- Tech workforce concentration: 6%
12. Chicago, Illinois
- Women tech workers: 17,940
- Women tech workers, share of tech workforce: 26%
- Women tech workers’ estimated median earnings (adjusted): $97,876
- Women tech workers’ estimated median earnings (unadjusted): $106,693
- Women tech workers’ earnings as a share of men’s: 90.2%
- Tech workforce concentration: 4.5%
13. Charlotte, North Carolina
- Women tech workers: 8,159
- Women tech workers, share of tech workforce: 28.7%
- Women tech workers’ estimated median earnings (adjusted): $91,689
- Women tech workers’ estimated median earnings (unadjusted): $93,921
- Women tech workers’ earnings as a share of men’s: 82.6%
- Tech workforce concentration: 5.4%
14. Memphis, Tennessee
- Women tech workers: 1,950
- Women tech workers, share of tech workforce: 33.2%
- Women tech workers’ estimated median earnings (adjusted): $84,718
- Women tech workers’ estimated median earnings (unadjusted): $82,173
- Women tech workers’ earnings as a share of men’s: 101.5%
- Tech workforce concentration: 1.9%
15. Houston, Texas
- Women tech workers: 9,456
- Women tech workers, share of tech workforce: 25.6%
- Women tech workers’ estimated median earnings (adjusted): $97,089
- Women tech workers’ estimated median earnings (unadjusted): $100,762
- Women tech workers’ earnings as a share of men’s: 93%
- Tech workforce concentration: 3%
16. Denver, Colorado
- Women tech workers: 6,759
- Women tech workers, share of tech workforce: 26.8%
- Women tech workers’ estimated median earnings (adjusted): $90,738
- Women tech workers’ estimated median earnings (unadjusted): $101,000
- Women tech workers’ earnings as a share of men’s: 82.2%
- Tech workforce concentration: 5.6%
17. Albuquerque, New Mexico
- Women tech workers: 2,459
- Women tech workers, share of tech workforce: 23%
- Women tech workers’ estimated median earnings (adjusted): $97,662
- Women tech workers’ estimated median earnings (unadjusted): $98,188
- Women tech workers’ earnings as a share of men’s: 92.1%
- Tech workforce concentration: 3.6%
18. New York, New York
- Women tech workers: 43,595
- Women tech workers, share of tech workforce: 26.5%
- Women tech workers’ estimated median earnings (adjusted): $96,782
- Women tech workers’ estimated median earnings (unadjusted): $114,634
- Women tech workers’ earnings as a share of men’s: 86.3%
- Tech workforce concentration: 3.7%
19. Columbus, Ohio
- Women tech workers: 6,298
- Women tech workers, share of tech workforce: 24.7%
- Women tech workers’ estimated median earnings (adjusted): $87,247
- Women tech workers’ estimated median earnings (unadjusted): $87,646
- Women tech workers’ earnings as a share of men’s: 91.5%
- Tech workforce concentration: 5%
20. Louisville, Kentucky
- Women tech workers: 2,740
- Women tech workers, share of tech workforce: 31.3%
- Women tech workers’ estimated median earnings (adjusted): $87,750
- Women tech workers’ estimated median earnings (unadjusted): $85,940
- Women tech workers’ earnings as a share of men’s: 91.8%
- Tech workforce concentration: 2.6%
21. Raleigh, North Carolina
- Women tech workers: 4,169
- Women tech workers, share of tech workforce: 24.6%
- Women tech workers’ estimated median earnings (adjusted): $89,325
- Women tech workers’ estimated median earnings (unadjusted): $92,261
- Women tech workers’ earnings as a share of men’s: 79.7%
- Tech workforce concentration: 6%
22. Miami, Florida
- Women tech workers: 1,385
- Women tech workers, share of tech workforce: 26.6%
- Women tech workers’ estimated median earnings (adjusted): $88,650
- Women tech workers’ estimated median earnings (unadjusted): $106,486
- Women tech workers’ earnings as a share of men’s: 101.7%
- Tech workforce concentration: 2%
23. Tampa, Florida
- Women tech workers: 2,485
- Women tech workers, share of tech workforce: 25.7%
- Women tech workers’ estimated median earnings (adjusted): $89,792
- Women tech workers’ estimated median earnings (unadjusted): $95,325
- Women tech workers’ earnings as a share of men’s: 84.5%
- Tech workforce concentration: 4.4%
24. Long Beach, California
- Women tech workers: 1,946
- Women tech workers, share of tech workforce: 27.6%
- Women tech workers’ estimated median earnings (adjusted): $84,787
- Women tech workers’ estimated median earnings (unadjusted): $101,320
- Women tech workers’ earnings as a share of men’s: 97.1%
- Tech workforce concentration: 2.8%
25. Colorado Springs, Colorado
- Women tech workers: 2,990
- Women tech workers, share of tech workforce: 19.3%
- Women tech workers’ estimated median earnings (adjusted): $93,558
- Women tech workers’ estimated median earnings (unadjusted): $99,142
- Women tech workers’ earnings as a share of men’s: 82.5%
- Tech workforce concentration: 5.8%
26. Fort Worth, Texas
- Women tech workers: 4,622
- Women tech workers, share of tech workforce: 28.7%
- Women tech workers’ estimated median earnings (adjusted): $87,174
- Women tech workers’ estimated median earnings (unadjusted): $94,564
- Women tech workers’ earnings as a share of men’s: 89.2%
- Tech workforce concentration: 3.2%
27. Indianapolis, Indiana
- Women tech workers: 4,200
- Women tech workers, share of tech workforce: 27.3%
- Women tech workers’ estimated median earnings (adjusted): $83,762
- Women tech workers’ estimated median earnings (unadjusted): $84,345
- Women tech workers’ earnings as a share of men’s: 94.7%
- Tech workforce concentration: 3.3%
28. Virginia Beach, Virginia
- Women tech workers: 3,094
- Women tech workers, share of tech workforce: 28%
- Women tech workers’ estimated median earnings (adjusted): $86,670
- Women tech workers’ estimated median earnings (unadjusted): $89,321
- Women tech workers’ earnings as a share of men’s: 82.6%
- Tech workforce concentration: 4.4%
29. Kansas City, Kansas
- Women tech workers: 3,234
- Women tech workers, share of tech workforce: 27.1%
- Women tech workers’ estimated median earnings (adjusted): $83,481
- Women tech workers’ estimated median earnings (unadjusted): $81,293
- Women tech workers’ earnings as a share of men’s: 84.8%
- Tech workforce concentration: 4.2%
30. Sacramento, California
- Women tech workers: 4,332
- Women tech workers, share of tech workforce: 35.4%
- Women tech workers’ estimated median earnings (adjusted): $73,005
- Women tech workers’ estimated median earnings (unadjusted): $81,943
- Women tech workers’ earnings as a share of men’s: 80.2%
- Tech workforce concentration: 4.4%
31. Tucson, Arizona
- Women tech workers: 2,038
- Women tech workers, share of tech workforce: 25.5%
- Women tech workers’ estimated median earnings (adjusted): $83,121
- Women tech workers’ estimated median earnings (unadjusted): $84,750
- Women tech workers’ earnings as a share of men’s: 93.7%
- Tech workforce concentration: 2.9%
32. Dallas, Texas
- Women tech workers: 6,478
- Women tech workers, share of tech workforce: 25.5%
- Women tech workers’ estimated median earnings (adjusted): $83,245
- Women tech workers’ estimated median earnings (unadjusted): $90,301
- Women tech workers’ earnings as a share of men’s: 87.7%
- Tech workforce concentration: 3.6%
33. Nashville, Tennessee
- Women tech workers: 4,244
- Women tech workers, share of tech workforce: 25.7%
- Women tech workers’ estimated median earnings (adjusted): $82,874
- Women tech workers’ estimated median earnings (unadjusted): $84,011
- Women tech workers’ earnings as a share of men’s: 83%
- Tech workforce concentration: 4.1%
34. Los Angeles, California
- Women tech workers: 14,663
- Women tech workers, share of tech workforce: 26.4%
- Women tech workers’ estimated median earnings (adjusted): $87,513
- Women tech workers’ estimated median earnings (unadjusted): $104,578
- Women tech workers’ earnings as a share of men’s: 83.4%
- Tech workforce concentration: 2.6%
35. Jacksonville, Florida
- Women tech workers: 5,749
- Women tech workers, share of tech workforce: 29%
- Women tech workers’ estimated median earnings (adjusted): $78,578
- Women tech workers’ estimated median earnings (unadjusted): $82,258
- Women tech workers’ earnings as a share of men’s: 79.7%
- Tech workforce concentration: 3.9%
36. Phoenix, Arizona
- Women tech workers: 8,129
- Women tech workers, share of tech workforce: 24.3%
- Women tech workers’ estimated median earnings (adjusted): $82,495
- Women tech workers’ estimated median earnings (unadjusted): $89,685
- Women tech workers’ earnings as a share of men’s: 83.2%
- Tech workforce concentration: 3.8%
37. Philadelphia, Pennsylvania
- Women tech workers: 7,629
- Women tech workers, share of tech workforce: 27.3%
- Women tech workers’ estimated median earnings (adjusted): $79,016
- Women tech workers’ estimated median earnings (unadjusted): $85,268
- Women tech workers’ earnings as a share of men’s: 84.5%
- Tech workforce concentration: 3.4%
38. Arlington, Texas
- Women tech workers: 2,110
- Women tech workers, share of tech workforce: 29.9%
- Women tech workers’ estimated median earnings (adjusted): $76,319
- Women tech workers’ estimated median earnings (unadjusted): $82,788
- Women tech workers’ earnings as a share of men’s: 83.5%
- Tech workforce concentration: 3.2%
39. Wichita, Kansas
- Women tech workers: 1,183
- Women tech workers, share of tech workforce: 24.6%
- Women tech workers’ estimated median earnings (adjusted): $83,970
- Women tech workers’ estimated median earnings (unadjusted): $78,591
- Women tech workers’ earnings as a share of men’s: 88%
- Tech workforce concentration: 2.3%
40. Oklahoma City, Oklahoma
- Women tech workers: 2,780
- Women tech workers, share of tech workforce: 24.2%
- Women tech workers’ estimated median earnings (adjusted): $81,087
- Women tech workers’ estimated median earnings (unadjusted): $77,140
- Women tech workers’ earnings as a share of men’s: 85%
- Tech workforce concentration: 3.1%
41. Omaha, Nebraska
- Women tech workers: 2,766
- Women tech workers, share of tech workforce: 24.2%
- Women tech workers’ estimated median earnings (adjusted): $81,323
- Women tech workers’ estimated median earnings (unadjusted): $78,651
- Women tech workers’ earnings as a share of men’s: 77.1%
- Tech workforce concentration: 4.3%
42. San Antonio, Texas
- Women tech workers: 5,367
- Women tech workers, share of tech workforce: 23%
- Women tech workers’ estimated median earnings (adjusted): $81,066
- Women tech workers’ estimated median earnings (unadjusted): $80,794
- Women tech workers’ earnings as a share of men’s: 84.6%
- Tech workforce concentration: 3%
43. Milwaukee, Wisconsin
- Women tech workers: 1,771
- Women tech workers, share of tech workforce: 25%
- Women tech workers’ estimated median earnings (adjusted): $76,034
- Women tech workers’ estimated median earnings (unadjusted): $77,556
- Women tech workers’ earnings as a share of men’s: 89.9%
- Tech workforce concentration: 2.5%
44. Detroit, Michigan
- Women tech workers: 1,807
- Women tech workers, share of tech workforce: 39.7%
- Women tech workers’ estimated median earnings (adjusted): $64,876
- Women tech workers’ estimated median earnings (unadjusted): $68,469
- Women tech workers’ earnings as a share of men’s: 79.5%
- Tech workforce concentration: 1.7%
45. Tulsa, Oklahoma
- Women tech workers: 1,400
- Women tech workers, share of tech workforce: 24.8%
- Women tech workers’ estimated median earnings (adjusted): $76,594
- Women tech workers’ estimated median earnings (unadjusted): $71,904
- Women tech workers’ earnings as a share of men’s: 81.6%
- Tech workforce concentration: 2.7%
46. Fresno, California
- Women tech workers: 1,321
- Women tech workers, share of tech workforce: 28.2%
- Women tech workers’ estimated median earnings (adjusted): $70,433
- Women tech workers’ estimated median earnings (unadjusted): $75,713
- Women tech workers’ earnings as a share of men’s: 87.2%
- Tech workforce concentration: 1.8%
47. Las Vegas, Nevada
- Women tech workers: 1,879
- Women tech workers, share of tech workforce: 22.5%
- Women tech workers’ estimated median earnings (adjusted): $77,138
- Women tech workers’ estimated median earnings (unadjusted): $81,343
- Women tech workers’ earnings as a share of men’s: 74%
- Tech workforce concentration: 2.5%
48. Mesa, Arizona
- Women tech workers: 2,276
- Women tech workers, share of tech workforce: 21.9%
- Women tech workers’ estimated median earnings (adjusted): $70,288
- Women tech workers’ estimated median earnings (unadjusted): $76,414
- Women tech workers’ earnings as a share of men’s: 72.3%
- Tech workforce concentration: 3.9%
49. El Paso, Texas
- Women tech workers: 1,291
- Women tech workers, share of tech workforce: 20.5%
- Women tech workers’ estimated median earnings (adjusted): $68,488
- Women tech workers’ estimated median earnings (unadjusted): $64,797
- Women tech workers’ earnings as a share of men’s: 76.7%
- Tech workforce concentration: 1.9%
50. Bakersfield, California
- Women tech workers: 849
- Women tech workers, share of tech workforce: 23.6%
- Women tech workers’ estimated median earnings (adjusted): $66,970
- Women tech workers’ estimated median earnings (unadjusted): $71,093
- Women tech workers’ earnings as a share of men’s: 65.5%
- Tech workforce concentration: 1.9%
Methodology
U.S. Census Bureau 2024 American Community Survey five-year estimates, representing survey data collected from 2020 through 2024, were analyzed for 50 of the largest U.S. cities by population. The analysis defined tech workers as city residents employed in computer and mathematical occupations. Each city received a composite score based on four weighted metrics: women’s median earnings as a percentage of men’s median earnings in tech; women’s share of all tech workers; tech employment concentration, calculated as tech workers’ share of the local population aged 16 and older employed or looking for work; and women tech workers’ median earnings, updated with a national wage index and adjusted for regional price differences.
For purposes of this study, workforce is synonymous with labor force. ACS earnings are reported in 2024 dollars. For comparability, each city’s median was updated to June 2026 using the national Bureau of Labor Statistics Employment Cost Index for private-industry wages and salaries. The same factor was applied to every city. Those figures were then adjusted using the Bureau of Economic Analysis’ all-items regional price parity for the metropolitan area containing each city. The updated amounts are not observed 2026 salaries, and ACS estimates may be subject to sampling and nonsampling error, particularly where occupational sample sizes are small. Rank differences should therefore be interpreted as directional rather than as evidence that similarly ranked cities are statistically distinguishable from one another. Source data providers are not affiliated with, and do not endorse or sponsor, this study or its findings.
This story was produced by SmartAsset and reviewed and distributed by Stacker.


